Creating and Editing Donut Charts
In the Report Designer, you can create donut charts which are ring-shaped diagrams split into individual sections. Each section represents a data point, and the size of each section is proportional to the number of items corresponding to that data point. You can define which columns are represented in the donut chart and apply filtering to further refine the scope of the data shown.
To create a donut chart report:
-
Click Reports on the primary ChangeGear navigation menu.
-
Click the New icon
 in the reports tool bar.
 -
The Report Creation dialog appears. Select the Donut Chart report.
-
Select the module to source the data from.
-
Select the view that will provide the data available in the report. The report uses the same filter criteria as the view.
-
Click Next. The Donut Chart Creation screen displays.
-
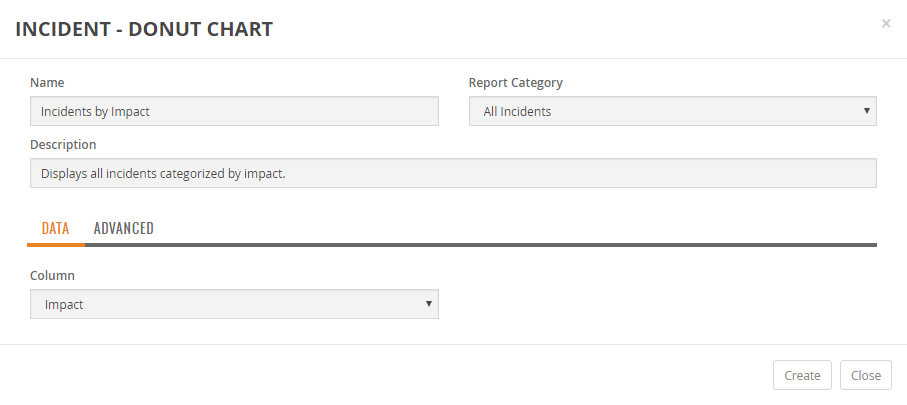
Enter a Name for the new report.
-
Optionally, enter a Description of the report.
-
Select a Report Category from the list. The Report Category determines which category within the module to save the report. The My Reports category is specific to your user account and is not visible to other users.
Data Tab
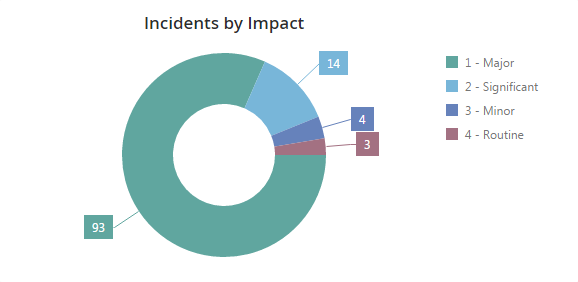
The Data tab is where you define the data used to populate the donut chart. The Column field allows you to specify which column to display in the donut chart. For example, if you wanted to show the total number of incidents by impact, select Incident for the module, All Incidents for the view, and set the Column field to Impact. The generated donut chart displays each impact level (Major, Significant, Minor, etc.) as a separate section of the donut. Each section also displays the number of tickets with that impact.
Note: Donut charts display up to five segments. If the column field has more than five unique values then the donut chart displays the five largest segments.
Advanced
The Advanced tab allows you to provide additional data filtering parameters.
To apply a filter:
-
Select a matching condition using the radio buttons.
-
Match All Conditions means the data must meet each one of the filtering options specified to appear in the view result set, (i.e., acts like an AND condition for filtering options).
-
Match Any Condition means the data can match any one of the conditions and is displayed in the view result set, (i.e., acts like an OR condition for filtering options).
-
-
Use the field drop-down to select a field to match on.
-
Use the value drop-down to select or provide a value to match on. The options available in the drop-down change depending on the field selected.
-
Press Add
 to add more filtering criteria. Press
  to delete criteria. You can add multiple filtering criteria as necessary for your report.
Create the Report
When you are finished entering your criteria, click Create to create the report.
Note: You can create a new report from an existing report by modifying the existing report and clicking Save As and providing a different name.
Editing a Donut Chart Report
ChangeGear allows you to edit the description, data column, and filter criteria of existing donut chart reports.
To edit a donut chart report:
-
Click Reports on the primary ChangeGear navigation menu.
-
Select a Donut Chart report from the Reports grid.
-
Click the Edit icon
 in the tool bar.
 -
Edit the Description as necessary.
-
Edit the Data Tab and Advanced options as shown above in the Create a Report section.
-
Click Save.
Note: You can create a new report from the current report by clicking Save As and providing a different name.