Creating and Editing Table Reports
In the Report Designer, you can create tabular reports which display data in a table format. You can define the module columns to display, filter criteria, grouping criteria and sort criteria.
To create a table report:
-
Click Reports on the primary ChangeGear navigation menu.
-
Click the New icon
 in the Reports tool bar.
 -
The Report Creation dialog displays. Select the Table report.
-
Select a module type for the table data used to create the report, (e.g., incident, problem, CMDB, assets, etc.). For example, select the Incident module to create a report regarding Incident tickets.
-
Optionally, you can select a view for the report, (e.g., All Incidents, Active Incidents, Closed Incidents, etc.). When a table report is based on a view, that report uses the same filter criteria as the view.
-
Click Next. The Table Report Creation dialog displays.
-
Enter the Name of the report.
-
Optionally, you can enter a Description for the report.
-
Select a Report Category from the list. The Report Category determines which category within the module to save the report. The My Reports category saves the report in your own My Reports category and is not visible to other users.
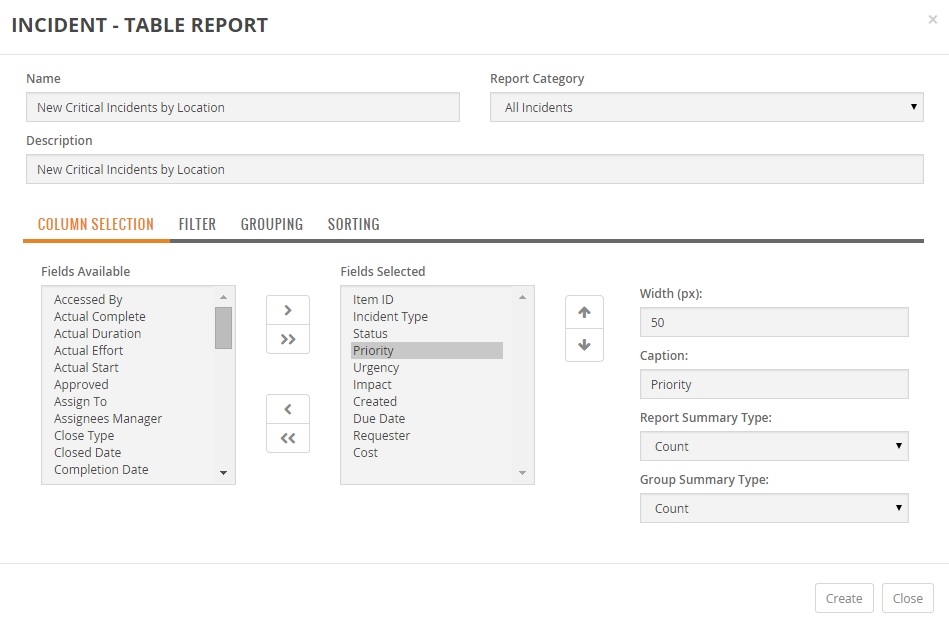
Column Selection
The Column Selection tab already highlighted in the Table Report creation dialog is where you can specify which columns to display in the table report.
-
Select from the Fields Available desired for the report. You can select multiple fields at once by holding down the CTRL key.
-
To add selections to the Fields Selected for the report, click the arrow pointing right
 . To select all available fields, click the double arrows pointing right
  . Similarly, you can remove fields
from the Fields Selected list, by clicking the arrow(s) pointing left.
. Similarly, you can remove fields
from the Fields Selected list, by clicking the arrow(s) pointing left. -
To arrange the order of the Fields Selected on the report, select the field and press the up arrow
 or down arrow
  .
. -
Select a field from the Fields Selected list. The following parameters apply to the Fields Selected.
-
Use the Width parameter to size the field length in pixels on the report.
-
The Caption parameter allows you to use a different name for the column heading on the report.
-
The Display Format field controls the appearance and format of date and/or number fields on the report. The Display Format field is visible only when you have selected a date or a numeric field such as cost. In addition to the formats shown below, you can use the date and time formats specified in the Windows Control Panel > Region and Language setting such as M/d/yyyy, MM/dd/yy, MM/dd/yyyy. Type in the format as you see it, (e.g., MM/dd/yyyy,). The format is case sensitive.
-
|
Date Formats |
|
|
d |
Represents the short date format in the US standard format; MM/DD/YYYY. For example, if the field contains value 6/15/2009 1:45:30 PM, the formatted date on the report displays as 6/15/2009. |
|
g |
Represents the general short date and time in the US standard format; MM/DD/YYYY HH:MM. For example, if the field contains value 6/15/2009 1:45:30 PM, the formatted date on the report displays as 6/15/2009 1:45 PM |
|
Numeric Formats |
|
|
c |
Represents currency format and specifies decimal places in the US standard format. Positive numbers are formatted as $.00. Negative numbers are formatted as ($.00). For example, if the field contains value 123.456, the formatted dollar amount on the report displays as $123.46. If the field contains value -123.45, the formatted dollar amount on the report displays as ($123.45). |
|
d |
Represents integer digits and can be positive or negative. For example, if the field contains value 1234, the formatted value on the report displays as 1234. If the field contains value -1234, the formatted value on the report displays as a negative -1234. |
|
n |
Represents integer and decimal digits using "," group separators, and a decimal separator with optional negative sign. For example, if the field contains value 1234.567, the formatted value on the report displays as 1,234.57. If the field contains value -1234.56, the formatted value on the report displays as -1,234.56. NOTE: n2 works the same as n. |
-
The Report Summary Type allows you to display a mathematical calculation at the bottom of the grid for this column. The mathematical formula for this field encompasses all rows that are displayed in the view. The mathematical formulas you can choose from are average, sum, minimum value, maximum value and count. For example, if you select the Cost field and the Report Summary Type of sum, the formula calculates the sum total cost for all rows displayed on the view.
-
The Group Summary Type also allows you to display a mathematical calculation at the bottom of each grouping for this column that appears on the grid. See above Report Summary Type for a description of types. For example, if you can select the Status field and the Group Summary Type of count, the formula counts the number of tickets for each status grouping on the grid.
Filtering Columns
You can optionally filter the data you want displayed in the report.
-
Select the Filter tab in the Table Report dialog.
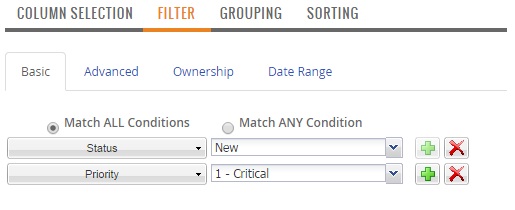
Basic Tab
The Basic Tab allows you to do simple filtering by selecting columns and required values.
-
Click the Basic tab to apply basic data filtering. Select data match conditions using the radio buttons.
-
Match All Conditions means the data must meet each one (all) of the filtering options specified to appear in the view result set, (i.e., acts like an AND condition for filtering options).
-
Match Any Condition means the data can match any one of the conditions and is displayed in the view result set, (i.e., acts like an OR condition for filtering options).
-
-
Press Select field. Select All to view all the fields available and select the proper field for match condition. For example, scroll down the fields to select the Status field.
-
Key in a conditional value for filtering data. When the field has fixed valid values a list shows the available values.
Tip: You can add a date range for filtering any date fields you have selected. You may enter $(DATE_RANGE) in the value field for the date you are filtering. Next, you can navigate to the Date Range tab to select a date range.
-
Press Add
 to add more filtering criteria. Press
  to delete criteria. You can add multiple filtering criteria as necessary for your report.
 -
When finished entering filter criteria, click Create, or continue filter criteria by clicking another tab choice, (e.g. Advanced, Ownership, Date Range.)
Advanced Tab
The Advanced tab allows you to create more complex filtering criteria using SQL-like queries.
-
Click the Advanced tab to code more complex queries. Any filtering criteria you have entered in addition to the selected view filtering criteria is shown here.
-
Add or the change query as necessary for your report.
Note: When switching to the Basic filtering tab, the system warns you that the Advanced filtering criteria is removed.
Ownership Tab
The Ownership tab allows you to limit the scope of the data displayed for the view based on what the user owns as well as what the user's team owns. Custom views appear under MY VIEWS group menu.
Click the Ownership Tab and select from the following:
-
All Viewable: All data for the report is visible to users on the grid, (ownership and team membership have no impact).
-
User's Team: Only data for the user's team displays on the grid for this report when the team is the Owner, or the Assigned to, or the Requester.
-
User's Own: Only data for which the user is the Owner, Requester or the Assigned to use, is visible on the grid for this report.
Date Range Tab
The Date Range tab enables you to create a default date range for your table date filter criteria and is used in conjunction with a value used in filtering criteria. Any dates used for filtering in the Basic tab or the Advanced tab can use the default date range.
-
Click the Date Range tab to set a default date range.
-
Select a Date Range from the list of date ranges, (e.g., current month, last 6 months, etc.). The $(DATE_RANGE) variable is set to the default date range selected.
-
Click the Advanced Tab. Thecode in this tab shows the variable $(DATE_RANGE) used as filtering criteria for the CreatedDateTime field filtering. For example, if you selected current month as your default date range on the Date Range tab, the report shows only those tickets created within the current month.
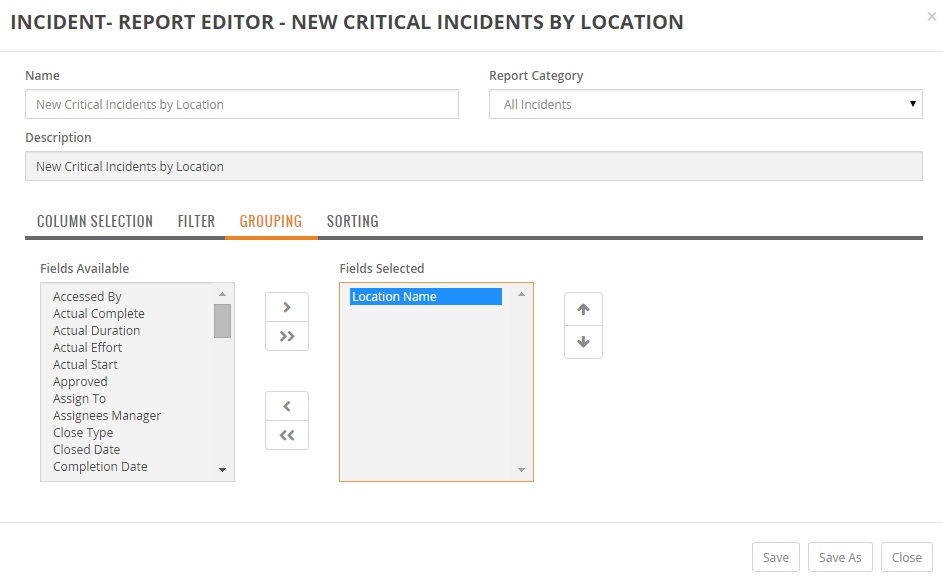
Grouping Columns
The Grouping tab in the Table Report Creation dialog allows you to optionally group the rows in the table report by one or more columns.
-
Select from the Fields Available for the desired grouping on the report. You can select multiple fields at once by holding down the CTRL key.
-
To add selections to the Fields Selected for report grouping, click the arrow pointing right
. To select all available fields, click the double arrows pointing right . Similarly, you can remove fields
from the Fields Selected list, by clicking the arrow(s) pointing left. -
To arrange the order of the Fields Selected columns on the report, select the column and press the up arrow
or down arrow .
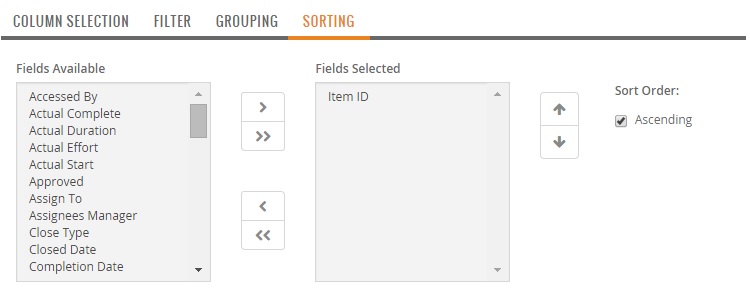
Sorting Columns
Sorting items in the report organizes your report rows in ascending or descending order. For example, sort by the Created date field to view tickets in oldest to most recent ticket order. You can also use sorting to organize your grouping columns in a meaningful way.
-
Select from the Fields Available columns for the desired sort columns on the report. You can select multiple columns at once by holding down the CTRL key.
-
To add selections to the Selected columns for report sorting, click the arrow pointing right
. To select all available columns, click the double arrows pointing right . Similarly, you can remove columns
from the Selected list, by clicking the arrow(s) pointing left. -
To arrange the order of the Selected columns on the report, select the column and press the up arrow
or down arrow . -
Select sort sequence by clicking on a Selected item and checking ascending sequence or no check for descending sequence.
Create Report
To render the report data on the grid, create the report by clicking Create.
Note: You can create new reports from existing reports by using the Save As option.
Editing a Table Report
ChangeGear allows you to edit a report and modify the column selection, filter criteria and other criteria similar to creating a table report.
To edit a table report:
-
Click Reports on the primary ChangeGear navigation menu.
-
Select a table report from the Reports Module grid. Click the Edit icon
 from the table Report tool bar.
Note: If a table report was previously created in the ChangeGear Desktop Client and the report is edited from the Report Designer on the web, the reports filter criteria is displayed only in the Advanced Filtering section and not in Basic Filtering section.
-
You can edit the Description as necessary.
-
The Report Designer allows you to change any report Column Selections, Filtering Criteria, Grouping Criteria, and Sorting as shown above in the Create a Table Report section.
-
Click Save.
Note: You can create new reports from existing reports by using the Save As option.