Creating and Editing Gauge Charts
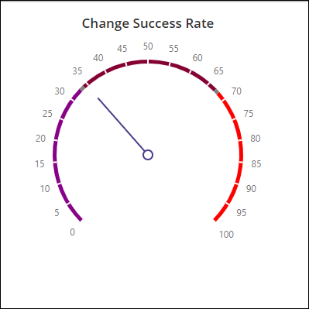
Gauge charts allow to quickly visualize data in dashboards. It is used to display a single data value against a target value with different color ranges to help understand KPIs for the set target.
The Report Designer provides the capability to create and update circular Gauge charts. The supported scale unit is percentage only.
To create a gauge chart:
-
Click Reports in the product navigation menu.
-
Under a module (e.g., Incident, Change Management), select a report category (Active Incidents, Active Requests, etc.) then click the New icon
 in the reports tool bar.
 -
The Report Creation dialog displays. Select the Gauge .
-
Select a module type for the table data, (e.g., incident, problem, CMDB, assets, etc.). For example, select the Incident module to create a chart using Incident tickets.
-
Select a view for the report, (e.g., All Incidents, Active Incidents, Closed Incidents, etc.). When a Gauge is based upon a view, that report uses the same filter criteria as the view.
-
Click Next. The Gauge Creation screen displays.
-
Enter the Name of the report.
-
Optionally, you can enter a Description for the report.
-
Select Report Category from the list. The Report Category determines which category within the module to save the report. The My Reports category saves the report in your own My Reports and is not visible to other users. You could use My Reports to work on a report before saving it into one of the module categories so others can access the report.
-
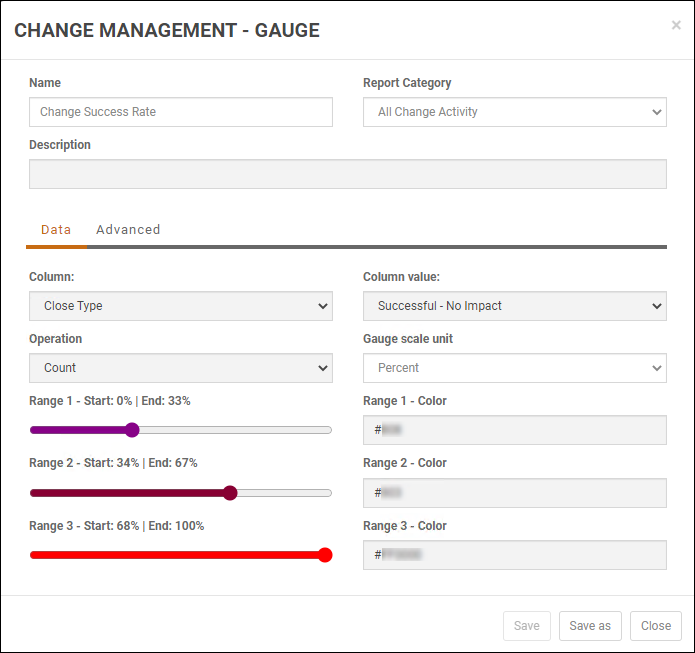
The Data tab allows you to define the data for the gauge chart. Complete the following fields.
-
The Column field identifies the table column to compare in the gauge chart.
-
The Column Value field enables you to specify the value used to report the percent on the gauge as compared with the total percent.
-
The Operation field has the count and sum options. You can count the number of tickets which shows as a percentage on the gauge or you can sum up all the values for the column field such as Cost.
Note: The sum option does not work for non-numeric fields like Assigned to or Due date.
For example, suppose you want to show the percentage of the total incident tickets In-Progress on a gauge chart. You would set the Column field to Status and the Column Value to In-Progress. The generated gauge renders a percentage of the number of tickets that are currently In-Progress as the gauge dial number in comparison with the total number of tickets (i.e., 100 percent).
-
The Range and Range Color fields enable you to configure up to three target range percentage(s) and to pick a color for each range.
Note: The Gauge Ranges cannot overlap. Values can be any three or six digit hex value (i.e., #000 or #000000, #FFF or #FFFFFF).
-
In the Advanced tab, you can optionally apply basic data filtering to the data displayed on the Gauge.
Note: This basic filtering allows you to further refine which tickets/items to include in the gauge other than the column equal value criteria in the Data Tab. You can optionally apply filtering to the count or sum fields. This filtering allows you to filter which values are used to count/sum fields displayed on the gauge report. For example, you can count the tickets by Priority that are Critical or High.
Please refer to the Filtering Columns Table Report section in Creating and Editing Table Reports.
-
To create the report, click Create.
Note: You can create new reports from existing reports by using the Save As option.
To edit a gauge report:
-
Click Reports on the primary navigation menu.
-
Select a Gauge report from the Reports Module grid.
-
Click the Edit icon
 from the Gauge tool bar.
 -
You can edit the Description as necessary.
-
The system allows you to change any report Data Tab or Advanced functions as shown above in the Create a Gauge Report section.
-
Click Save.
Note: You can create new reports from existing reports by using the Save As option.